

Design Thinking Workshop

Carbon Offset Application
About The Customer
A major brand in middle east running Car Services App platform offering
Problem Statement
Ability to figure out Sales performance with interactive forecast horizon, sales target and discount rates. Key metrics required were:
- Customer LIfe Time Value
- Sales Forecast
- Split Data by Region
- Monthly Sales Growth
- Tax Paid
- Weekly Sales
Project Scope
- Design and develop a fully interactive web-based dashboard
- Apply time series forecasting and predictive modeling techniques
- Enable users to manipulate key business variables (e.g., time horizon, discounts) and instantly view updated forecasts
- Provide the ability to slice and dice data by region, time period, and product segment
- Deploy a cost-effective and self-contained analytics solution
Our Approach
We started with in-depth stakeholder interviews to map out analytical needs, data sources, and business KPIs. The project followed an iterative development cycle using Agile principles:
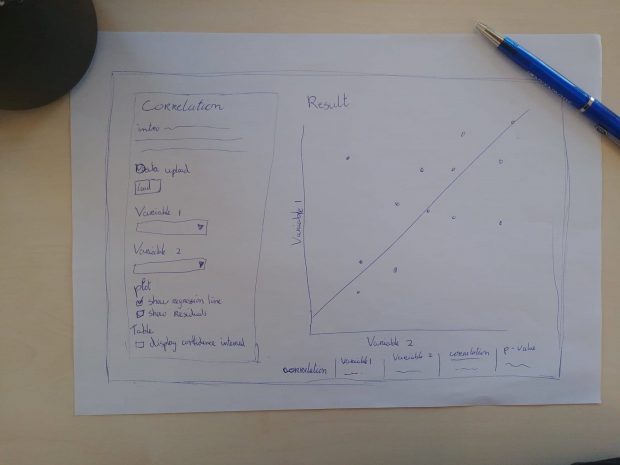
- Sprint 1: Requirements gathering, prototype design in R Shiny
- Sprint 2: Data ingestion pipeline and model training
- Sprint 3: UI development with dynamic controls and regional drill-downs
- Sprint 4: Testing, stakeholder validation, and deployment
Technical Solution Design
Technology Stack
- R: Core language for statistical modeling and data wrangling
- Shiny: Interactive web framework for real-time user interaction
- Time Series Forecasting Models:
- ARIMA
- Exponential Smoothing
- SARIMA for seasonality-aware forecasts
- ARIMA
- Data Sources: Aggregated transactional and regional sales data from the client’s backend systems
Key Features
Forecasting Engine (Time Series Models)Sales forecasts generated using ARIMA, allowing:
- Sales forecasts generated using ARIMA/SARIMA, allowing:
- Confidence intervals
- Weekly and monthly projections
- Seasonality adjustments (e.g., holidays, weekends)
- Confidence intervals
- Reacts to user inputs like:
- Forecast horizon (e.g., 4 weeks, 3 months, 12 months)
- Discount rate assumptions
- Region or city selection
- Forecast horizon (e.g., 4 weeks, 3 months, 12 months)
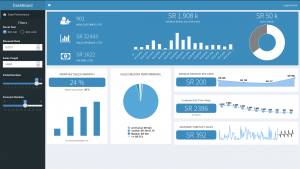
Dashboard Panels
- Sales Forecast
- Time series plot with actuals and predicted values
- Overlay of targets and discount impact
- Time series plot with actuals and predicted values
- Customer Lifetime Value
- Calculated using revenue per user, churn rate, and retention periods
- Segmented by region and service type
- Calculated using revenue per user, churn rate, and retention periods
- Regional & Temporal Analytics
- Regional sales breakdown (heatmaps and charts)
- Monthly sales growth trends
- Weekly sales and tax insights
- Regional sales breakdown (heatmaps and charts)
Interactive Controls
- Drop-downs, sliders, and date pickers to:
- Adjust business inputs
- Instantly re-run forecasts and refresh visualizations using Shiny’s reactive framework
- Adjust business inputs
Deployment & Infrastructure
- Hosted on a shiny.io
- No third-party licensing needed — 100% open-source and maintainable by the client
Success Factors
The biggest challenge with the Data based products is the cost. We offered our client very cost effective custom developed dashboard with the ability to interactive change variables to drive prediction and analysis